Byte Me!
  • Byte Me! Main Page
  • Yesulga: A multiplayer virtual reality drawing simulation
    • Yesulga: A multiplayer virtual reality drawing simulation
  • Ideation and Prototyping Fall 2018
    • Week 1!
    • Week 2!
    • Week 3!
    • Week 4!
    • Week 5!
    • Week 6!
    • Week 7!
    • Week 8!
    • Week 9!
    • Week 10!
    • Week 11!
    • Week 12!
      • Week 13!
    • Week 14!
  • Data Visualization Fall 2018
    • Week 1! - Introduction
    • Week 2! - Start Visualizing
    • Week 3! - Phase 1 and The Community Partner
    • Week 4! - Medical School and 2010 U.S Population DataVis
    • Week 5! - Self-guided tour of NYSCI and Book Thoughts
    • Week 6 & 7! - Reflection on ProPublica and NYU Data Services
    • Week 8! - MIT CREATE UPDATE
    • Week 9! - Phase 2 and MIT CREATE
    • Week 10! - MIT CREATE UPDATE
    • Week 11! - Thanksgiving and MIT CREATE
    • Week 12! - MIT CREATE Progress and Toolkit Post
    • Week 13! - PROGRESS!
    • Week 14! - Final Presentation!
  • Narrative VR Spring 2019
    • Week 1
    • Week 2
    • Week 3
    • Week 4
    • Week 5
    • Week 6 - MIDTERM
    • Week 7
    • Week 8
  • Valen Lab
    • Week 9
Powered by GitBook
On this page
  1. Data Visualization Fall 2018

Week 13! - PROGRESS!

PreviousWeek 12! - MIT CREATE Progress and Toolkit PostNextWeek 14! - Final Presentation!

Last updated 6 years ago

  • Progress Post: Please write a short post on any relevant project updates, including new visualizations, discussions in your group, discussions with your community partner, etc.

  • Zhenwen, Kate, and I talked about who is going to see this data visualization? Academia and MIT CREATE's community partners.

  • For the next data visualization, here is a rough idea for visualizing basic utilities:
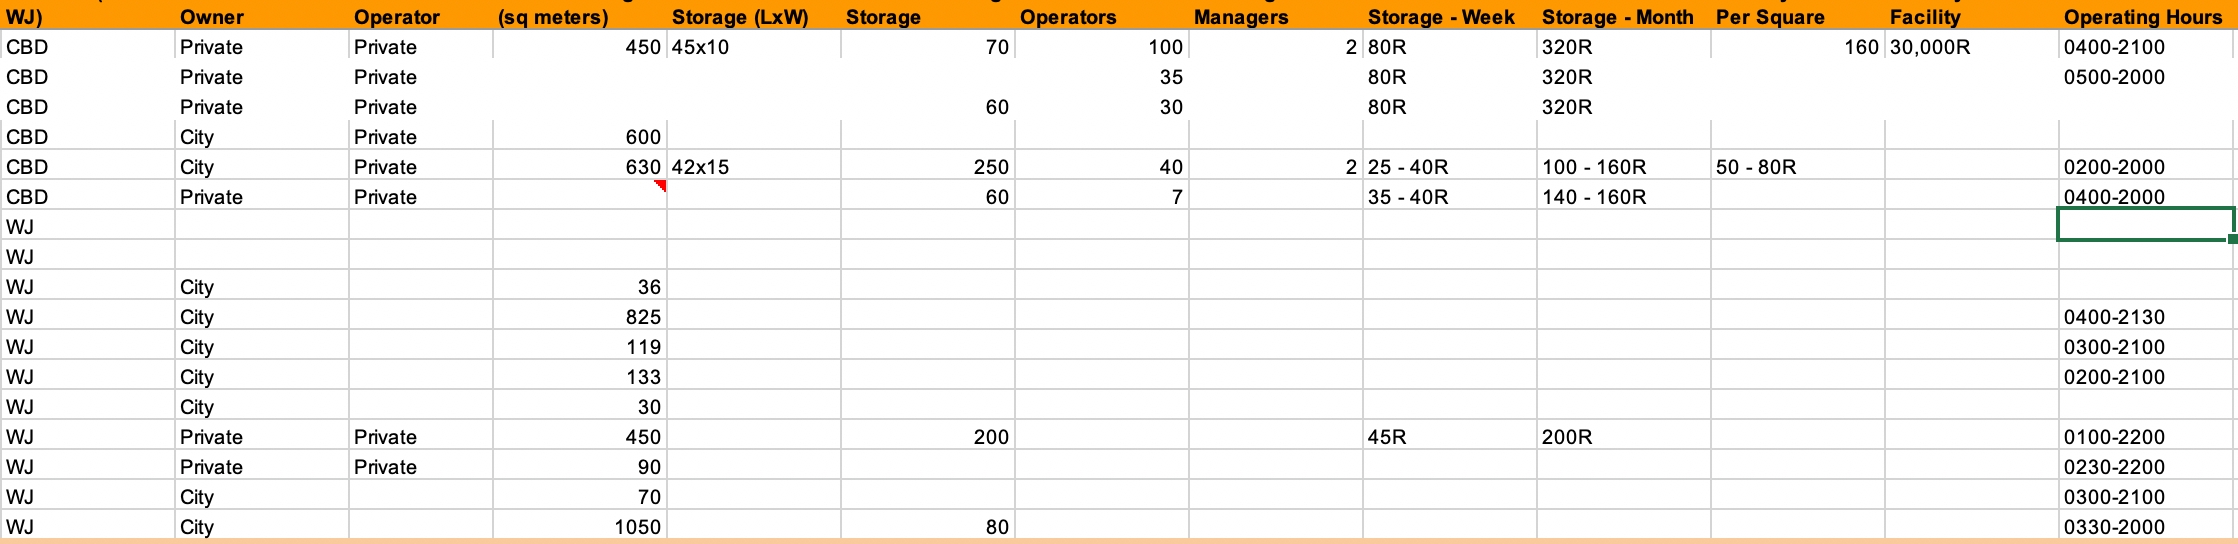
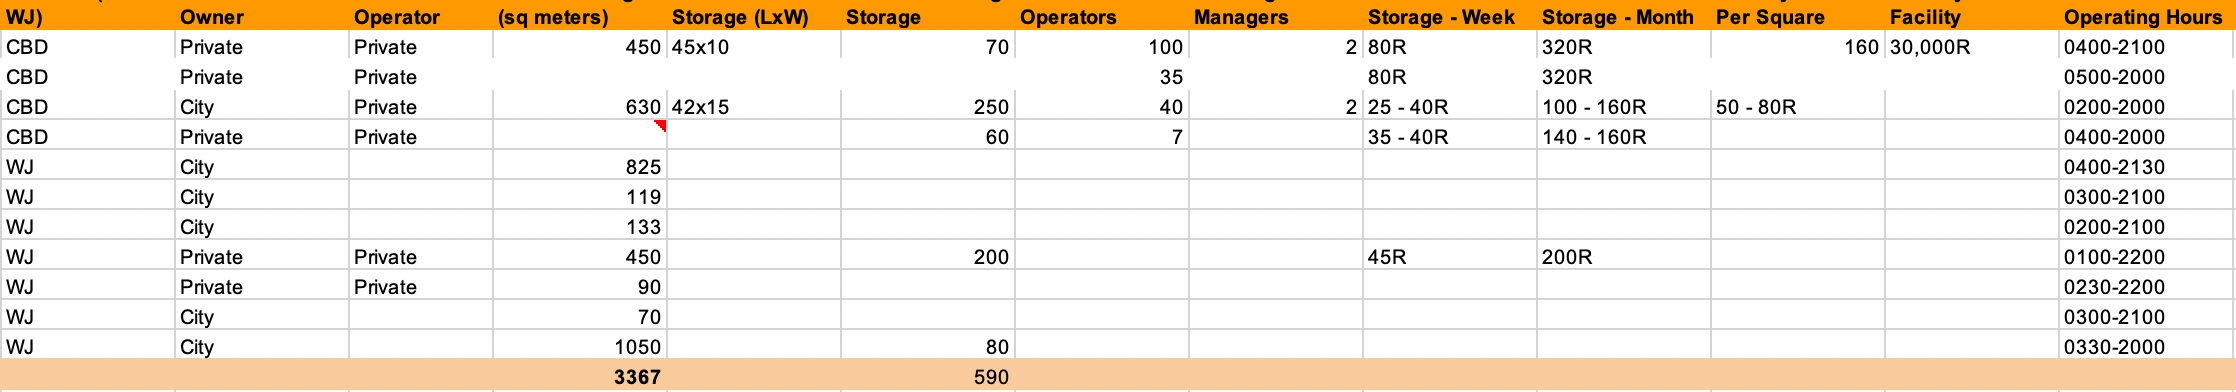
Storage:

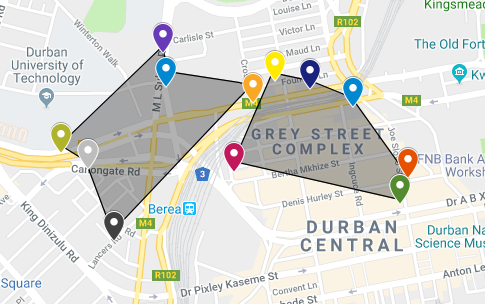
Tell story about how much movement there is between vendors and storage sites.

Data Visualization Draft
Rough DataViz Example for Lime and Imphepho
Unfiltered Storage data
Cleaned Data with Operating Hours